Fixing errors
This chapter tells you about the infamous WSOD, and the equally infamous internal server error, and what you can try to see the real reason your Drupal website is no longer in a working state. It also tells you how to report errors.
Table of contents
Introduction
White screen of death
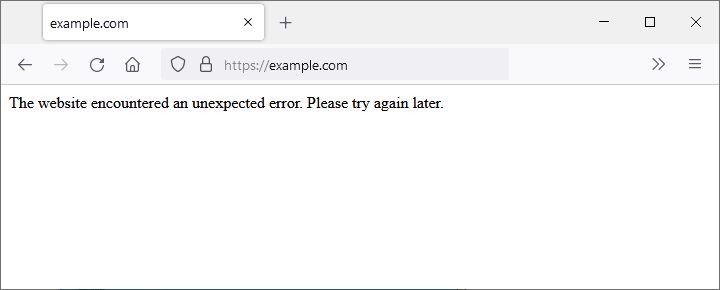
When something goes wrong, and instead of your website, you see a white screen and the following words:
The website encountered an unexpected error. Please try again later.

It is Drupal's default error message. It just means something went wrong. A production site is normally set up to show it on all errors in order to not expose internal information to the public.
 In
the Drupal community, this is known as the White Screen Off Death, or just WSOD.
This is because it is white, and informs you that your website has died.
If you're subscribing to managed Drupal hosting from HNM, you can hire us to fix it. See the section with title Now what? and ask us to help you fixing it. We will charge an hourly fee for this.
But to figure it out yourself, you need to find out what really went wrong. Below you find some tips about what to try.
Things to try
Below are five suggestions. The first two are things you can do provided the site still has enough functionality to let you do those things in the GUI.The last three requires you to have access to the Gnu/Linux Command Line Interface (CLI) and also knows you way around Gnu/Linux.
- Examine recent log messages using the GUI.
- Enable full error reporting using the GUI.
- Enable full error reporting using the CLI.
- Use the CLI and drush.
- Examine webserver logs using the CLI.
If you're still able to use the site, you can navigate to to look at recent log messages. For historic reasons these messages is also known as the "watchdog log".
You may also try to enable full error reporting using the GUI. To do so, navigate to and select "All messages" under "Logging and errors". This will let you examine all error messages, inclusing a stack trace of the calls leading up to the error.
This is best done on a staging site. Don't leave this permanent enabled on a production site, as it has security implications. Set it back to "None" on a production site after you've located the error.
If you subscribe to managed Drupal hosting from HNM, you will have access to the CLI provided your plan is for a a private vhost.
If you're unable to use the GUI, but have access to the CLI, you
can enable full error reporting by editing your
website's settings.php It lives in the
direcory site/defult/settings.php below your webroot.
Open up settings.php in your favourite editor and add the
following setting below any other assignments to
the $config-array that exist.
$config['system.logging']['error_level'] = 'verbose';
Then, the WSOD will show the real error in addition to the default message.
 This
setting takes precedense over the one set by the GUI. If you have a
dedicated development site, settings this here saves you from having
to reset it in the GUI when you import your database from the
production site to the testing site.
If you've access to the CLI and drush is available, you may try one of the following commands. Make sure you're located in or below the site root when you do this:
$ drush watchdog-show
$ drush ws
It will output the most recent log messages.
To delete all watchdog messages:
$ drush wd-del all
You may also examine your webserver logs. On a Drupal web
server managed by HNM, the file to examine is
/var/log/apache2/error.log. You will not get access to
this file unless your user has been set up with permission to use sudo.
Most of our customers will not have this permission. However, if you
have some tehnical experience with Gnu/Linux system administration, you
may get this permission under a custom plan.
Internal server error
The client application gets an HTTP status code of 500 with the message "Internal Server Error" as a response when something goes wrong with the webserver.
This is is a generic error response. It means that the server encountered an unexpected condition that prevented it from fulfilling the request. This error is usually returned by the server when no other error code is suitable.
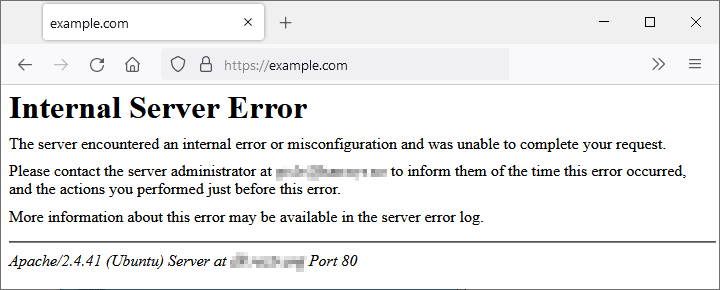
The default error page looks like this if the website is running Apache 2 as its webserver:

You may get a slightly different error page, because a website can customize it, but you'll almost always see the string "Internal Server Error", the number "500", or both.
 If
you're using the Microsoft IIS webserver, more specific
information about the cause of a particular 500 error is often
provided. Look for a number after 500, as in HTTP Error 500.19 -
Internal Server Error, which means: "Configuration data is invalid".
See this page on Lifewire.com for the full list.
The first thing to do is to examine the webserver logs as described above. Hopefully, this will tell you exactly what went wrong.
If the logs don't help, here is a list of the four mots common causes of internal server errors on a website built om Drupal:
- Corrupted
.htaccessfile - Permissions problems
- PHP memory or timing limits exceeded
- Faulty extensions
First, check if the problem affects everyone, or if the problem is local. You can do this my pasting the URL that produces the error into the website "Down for Everyone or Just Me"
If the problem only affects you, the first thing to do is to reload the page. On Microsoft Windows you do this by pressing F5 or Ctrl+R.
If this doesn't help, try to clear your browser's history and cache, and delete your browser's cookies.
Things to try
If the error affects everyone, read on.
Check your site's .htaccess file
Try to rename the .htaccess file. Renaming it will
stop the webserver using it, so it will stop clean URLs from working
on a Drupal website, and introduce orher errors, but if renaming it
removed the 500 error, you know it is the culprit.
Check permissions
In most cases, a 500 Internal Server Error is due to an incorrect permission on one or more folders or files.
The webserver need to have permission to access folders and files that contains configuration files, or executable PHP and Javascript. Check permissions and make sure they're set correctly.
Check that PHP limits are not exceed
If the issue is related to PHP timeouts, consider creating timeout rules or error handling in your script to resolve the issue.
Very often, this type of error is caused by bugs in the code (e.g. a runaway loop or an infinite recursion), exhausting available resoueces.
Uninstall extensions
Newly installed or updated extensions (i.e. modules, themes, third-party scripts) may conflict with your server configuration. To check for this, try to (carefully) uninstall extensions, one at a time, to identify if one of them is causing the problem.
If your website is set up to use the PGP filter extension, faulty PHP in the database may be the cause. Deactivate it.
Check status
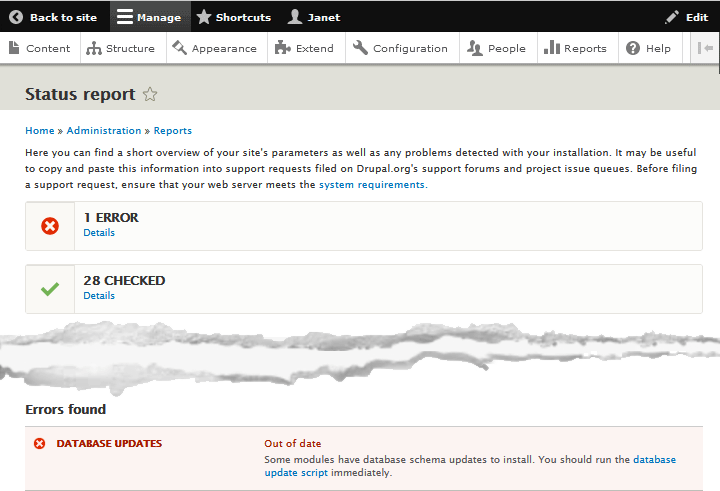
You may also want to check site health. You do this in the administrator GUI by navigating to . It will show you if there are any errors, and a bit further down on the page, what those errors are.

For example, in figure 19-3, it tells you that your database is out of date compared to the code base, and you should run the database update script immediately.
The status report checks a lot of site health parameters (currently 29 in all). There is no CLI command that will do this, but you can use the CLI and drush to see if there is any pending database updates. Use this command:
$ drush updb --no
 ----------------------- ----------- --------------- -------------------------
  Module                  Update ID   Type            Description
 ----------------------- ----------- --------------- -------------------------
  personal_things_todo     8207        hook_update_n   8207 - Add Primary Key
 ----------------------- ----------- --------------- -------------------------
…
The output from this command shows you all pending updates. If there a no pending updates, it will tell you:
$ drush updb --no
 [success] No pending updates.
Now what?
Now that you've found out more about the error, you may Search for a solution on the Internet. If you find one – and you subscribe to managed hosting by HNM – file a support request with HNM. We shall check out the solution. If it really solves the problem, we shall deploy the solution on your website free of charge. If you manage your website yourself, you may deploy the solution on your site.
If you are unable to find a solution, the recommended course of action is to report the problem to HNM, by contacting us and request support. We will investigate, and see if it is error is already known and resolved. If we're able to find a solution, we will deploy it on your website and only charge for one (1) hour of work at our standard rate.
If there is no known solution, we will analyse the relevant log messages, and report in in the appropriate place on Drupal.org, and follow-up on any community efforts to resolve it. We will not charge you for this.
Beyond what is said above, HNM will not do more to fix the error, unless you hire us to do so. Doing debugging and fixing a bug are outside the scope of our managed Drupal hosting service. We will help you, but only if you agree to be charged by the hour at our standard rate for this type of work.
Last update: 2022-04-06.